
Accounts receivable metrics are essential for understanding how efficiently your business collects payments, which directly impacts cash flow and financial health. Days Sales Outstanding (DSO), Accounts Receivable Turnover Ratio, Aging Schedules, and Bad Debt Metrics are the key tools for tracking receivables performance. Here’s what you need to know:
- DSO: Measures the average time it takes to collect payment after a credit sale. A lower DSO means faster collections.
- Accounts Receivable Turnover Ratio: Indicates how often receivables are converted to cash in a given period. Higher ratios suggest better efficiency.
- Aging Schedule: Breaks down invoices by age to identify overdue accounts and potential risks.
- Bad Debt Metrics: Tracks uncollectible receivables and their impact on profitability.
Each metric offers unique insights into your receivables process and helps identify issues like late payments, credit risks, or inefficiencies. By combining these tools, you can better forecast cash flow, improve collections, and minimize financial risks.
1. Days Sales Outstanding (DSO)
Definition and Formula
Days Sales Outstanding (DSO) tracks how many days, on average, it takes for your business to collect payment after making a credit sale.
The formula is simple: (Accounts Receivable ÷ Total Credit Sales) × Number of Days in the Period. For instance, if your company has $100,000 in accounts receivable, $500,000 in credit sales for the quarter, and you’re measuring over 90 days, the DSO calculation would be ($100,000 ÷ $500,000) × 90 = 18 days.
What It Measures
DSO is a critical metric for understanding cash flow and assessing receivables management. It provides insight into three key areas: your company’s liquidity, the efficiency of your collections team, and the creditworthiness of your customers. It can also serve as an indirect indicator of customer satisfaction – delayed payments often hint at dissatisfaction.
A DSO under 45 days is generally seen as a healthy benchmark for most industries. However, targets differ depending on the sector. For example, SaaS companies usually aim for 20–30 days, retail businesses target 30–40 days, and construction firms often deal with 60+ days. High-performing businesses across sectors tend to keep DSO below 30 days, while those facing challenges may exceed 48 days.
Key Strengths
One of DSO’s biggest advantages is its clarity and ease of use. It provides a straightforward number that can act as an early warning signal. If your DSO starts to rise, it might point to issues with collections, customer credit reliability, or even customer satisfaction.
Limitations
Despite its usefulness, DSO has some limitations. It only factors in credit sales and excludes cash transactions, which can distort the results. Including cash sales in the calculation can make your DSO appear lower than it truly is, giving a false sense of efficiency. Additionally, sudden sales spikes or seasonal trends can skew DSO figures, making it seem like collections have improved when they haven’t. To get a more accurate picture, it’s better to compare this month’s DSO to the same month in the previous year instead of to the prior month.
Next, we’ll dive into the Accounts Receivable Turnover Ratio to further explore cash flow efficiency.
A/R Metrics – Accounts Receivable Metrics – how to measure and track receivables
2. Accounts Receivable Turnover Ratio
Building on the insights provided by Days Sales Outstanding (DSO), the Accounts Receivable Turnover Ratio offers a closer look at how often and efficiently a company collects its receivables.
Definition and Formula
The Accounts Receivable Turnover Ratio reflects how many times a company collects its average accounts receivable balance within a given period. In simpler terms, it shows how frequently receivables are turned into cash.
The formula is:
Net Credit Sales ÷ Average Accounts Receivable
To calculate the average accounts receivable, use:
(Beginning AR + Ending AR) ÷ 2
For example, if a company reports $600,000 in net credit sales and has an average AR balance of $75,000, the turnover ratio would be 8. This means the company collects its receivables eight times a year.
What It Measures
This ratio is a key indicator of how well a company manages its credit policies and collection efforts. A high turnover ratio suggests efficient collections and stricter credit terms, while a low ratio could indicate relaxed credit policies or inefficiencies in collecting payments.
"The accounts receivable turnover ratio is one metric to watch closely as it measures how effectively a company is handling collections. If money is not coming in from customers as agreed and expected, cash flow can dry to a trickle."
- Scott Beaver, Sr. Product Marketing Manager, NetSuite
Industry benchmarks for this ratio vary widely. In Q1 2024, the retail trade sector averaged 39.14, technology came in at 24.41, and finance lagged with 5.11. Generally, ratios below 5 are considered poor, 5–10 average, and anything above 10 is seen as strong. Software companies often aim for 12–20, while service-oriented businesses usually target 6–10.
Key Strengths
One of the standout benefits of this ratio is its ability to enhance cash flow predictability, which helps businesses plan their investments and manage expenses more effectively. Unlike DSO, which relies on end-of-period AR balances, this ratio uses an average balance, smoothing out fluctuations over time. Additionally, it allows companies to benchmark their performance against industry standards, providing a clearer picture of their collection efficiency.
Limitations
While useful, the ratio does have its shortcomings. It offers a broad view of receivables management but lacks the detail needed to pinpoint specific customers who may pose a credit risk or are close to financial trouble. For businesses with seasonal fluctuations or those using total sales instead of net credit sales, the ratio can be skewed, making comparisons more challenging.
To get a more detailed understanding, it’s often helpful to pair this ratio with an accounts receivable aging report, which breaks down outstanding invoices by age. This combination provides a more comprehensive picture of receivables performance, highlighting both strengths and potential risks.
3. Aging Schedule and Percentage Past Due
Alongside metrics like DSO and turnover ratio, the aging schedule provides a closer look at the quality of a company’s receivables. While the turnover ratio measures how quickly payments are collected overall, the aging schedule breaks down invoices into age groups, helping identify high-risk accounts that may lead to collection issues.
Definition and Formula
An aging schedule categorizes invoices by their age, typically using 30-day intervals: Current (0–30 days), 31–60 days, 61–90 days, and Over 90 days. The percentage past due is calculated by dividing the total past-due receivables by the total accounts receivable, then multiplying the result by 100. Companies often estimate bad debt by applying historical default rates to these buckets – for example, 1% for current invoices, 5% for those 31–60 days overdue, and 15% or more for invoices past 60 days.
What It Measures
This report evaluates the quality of receivables by highlighting how much capital is tied up in overdue accounts and identifying customers at risk of default. While DSO gives a broad average of collection times, the aging schedule pinpoints whether delays are caused by a few overdue invoices or a larger slowdown in collections.
"If the aging report shows a lot of older receivables, it means that the company’s collection practices are weak."
- Jeff Schmidt, CFI
In the United States, small businesses are burdened with approximately $825 billion in unpaid invoices – equivalent to nearly 5% of GDP. Late payments account for 49% of B2B sales, averaging a 73-day collection cycle, with bad debts reaching 6% .
Key Strengths
The aging schedule goes beyond high-level metrics, offering actionable insights. For example, invoices in the 31–60 day range might prompt follow-up calls, while those older than 90 days may require escalation to a collection agency. This detailed breakdown helps management spot customers who are becoming credit risks and predict potential cash flow challenges. A sudden shift in receivables toward older time buckets can act as an early warning signal, even if overall sales remain strong. This granular view also supports better forecasting of bad debts and cash flow.
Limitations
Timing is critical when interpreting aging reports. For instance, a report generated right after month-end billing might overstate "current" receivables, while one created just before billing could understate expected cash inflows. Unapplied credit memos can also distort the data, making overdue balances seem higher than they actually are. For businesses with high invoice volumes, weekly or biweekly reviews are often necessary. Additionally, the time buckets in the report should align with the company’s credit terms – if terms are "Net 15", the first bucket should cover 0–15 days instead of the standard 30-day intervals.
sbb-itb-b840488
4. Bad Debt Metrics
While the aging schedule highlights overdue invoices, bad debt metrics zero in on the financial toll of receivables that are unlikely to be collected. One key metric here is the Bad Debt-to-Sales Ratio, also known as the Write-off Ratio. It calculates the percentage of total sales expected to be written off as bad debt, using the formula:
(Bad Debt ÷ Total Sales) × 100.
A ratio below 15% usually reflects strong credit management practices. On the other hand, if it climbs above 25%, it may signal weak credit controls and a heightened financial risk.
Definition and Formula
Bad debt can be estimated through two main approaches:
- Sales Method: Applies a fixed percentage to credit sales.
- Aging Method: Assigns default probabilities based on how long receivables have been outstanding.
The resulting estimate is recorded in the Allowance for Doubtful Accounts, ensuring that potential losses are accounted for in financial statements.
Another helpful metric is Average Days Delinquent (ADD), which tracks the average time it takes for overdue invoices to be paid. This can act as an early warning system for accounts that might eventually become uncollectible. Together, these tools provide a clearer picture of receivables risk.
What It Measures
Bad debt metrics reveal the portion of accounts receivable unlikely to be converted into cash, which directly impacts net income through bad debt expenses. A high level of uncollectible debt often signals poor receivables quality and potential liquidity issues. These metrics also help businesses strike a balance between credit terms that are too lenient (leading to excessive write-offs) and those that are too strict (which could hinder sales growth).
"High bad debt ratio hurts profitability."
- Emagia Staff
Many companies aim to keep their bad debt ratio between 1% and 2%. However, aiming for zero bad debt might backfire, suggesting overly conservative credit policies that could limit profitable sales opportunities.
Key Strengths
Bad debt metrics ensure that financial statements reflect the actual value of receivables. Using the allowance method, companies record anticipated credit losses close to the time of sale. This aligns with the accounting matching principle and helps track "Revenue at Risk" by identifying high-risk accounts.
These metrics also allow businesses to allocate resources effectively by focusing collection efforts on accounts most likely to default. Unlike metrics like Days Sales Outstanding (DSO), which emphasize collection speed, bad debt metrics focus on the ultimate collectibility and quality of receivables.
Limitations
There are some challenges with bad debt metrics. They rely on historical data and assumptions, which may not accurately predict future losses, especially if customer behavior or economic conditions shift. Additionally, these are lagging indicators, reflecting the outcomes of credit decisions made months earlier.
Their accuracy depends on regularly updated aging reports and consistent application of default probabilities across different time buckets. It’s also worth noting that under the allowance method, writing off a specific bad account doesn’t affect the income statement at the time of the write-off, as the expense was already accounted for in prior periods.
Comparing the Metrics: Strengths and Weaknesses
Accounts Receivable Metrics Comparison: Strengths, Uses, and Limitations
Building on the detailed overview of each metric, this comparison sheds light on their individual strengths and weaknesses, helping you understand how they contribute to cash flow management.
Each metric brings a distinct perspective to cash flow analysis. Days Sales Outstanding (DSO) is particularly valued for its simplicity – it only requires three data points (accounts receivable, credit sales, and days) to offer a quick look at how fast collections are happening. However, as Investopedia points out:
"DSO is not a perfect indicator of a company’s accounts receivable efficiency. Changes in sales volumes can affect DSO; higher sales often lower the DSO".
This limitation means DSO may not be as reliable during periods of rapid growth or seasonal fluctuations.
The Accounts Receivable Turnover Ratio is excellent for understanding how often receivables are turned into cash within a year, making it a valuable tool for tracking liquidity trends. Ryan Grundy from Sage explains:
"A higher AR turnover ratio means you’re collecting receivables more frequently, which is great for maintaining a healthy cash flow".
However, this metric relies on averages, which can sometimes obscure urgent account-specific issues.
For identifying accounts at risk of default, the Aging Schedule and Average Days Delinquent (ADD) provide actionable insights. ADD focuses on delays after the due date, serving as a helpful early warning system for potential bad debt. On the other hand, the Collections Effectiveness Index (CEI) measures collection team performance by calculating the percentage of available cash collected, unaffected by sales volume changes. A CEI score of 80% or higher is generally seen as a strong indicator of effective collections.
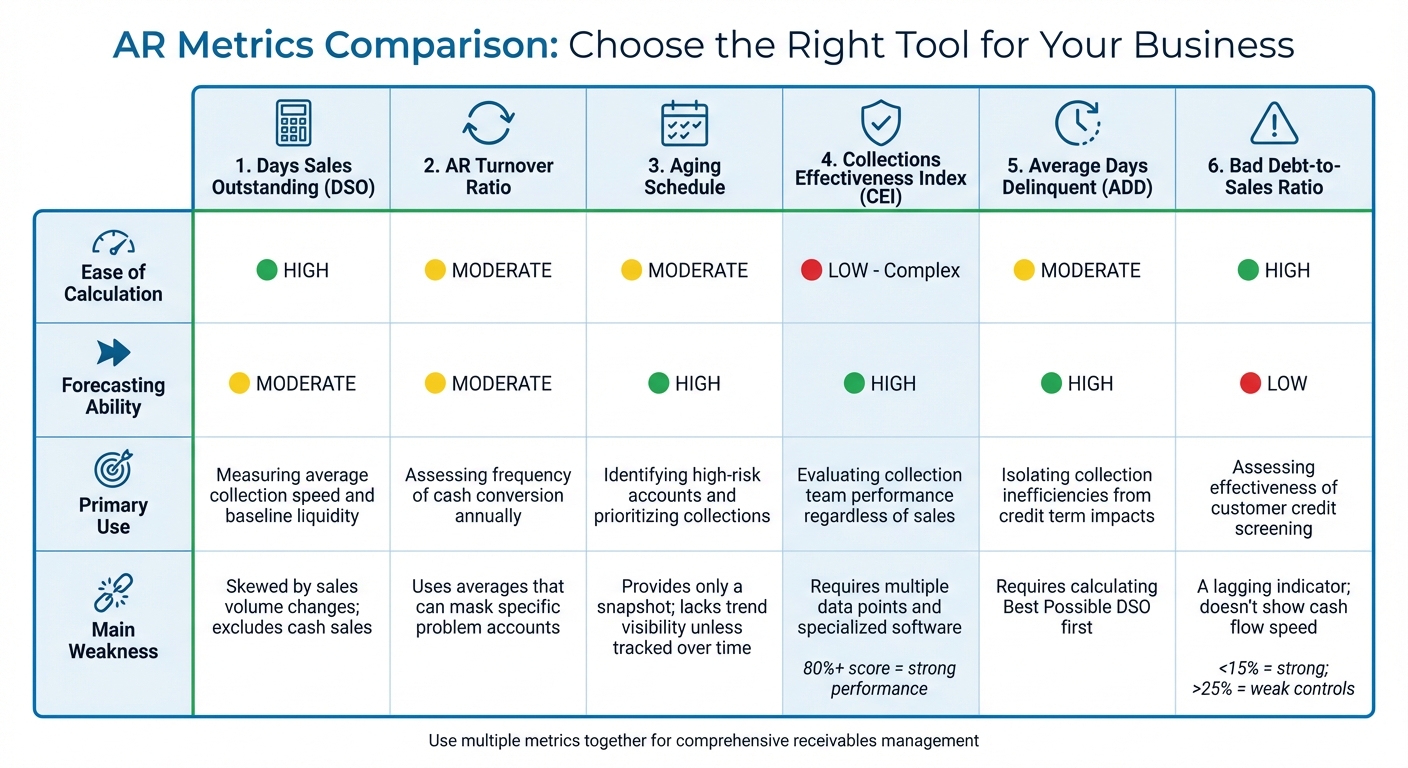
Here’s a quick comparison of these metrics based on key factors:
| Metric | Ease of Calculation | Forecasting Ability | Primary Practical Use | Main Weakness |
|---|---|---|---|---|
| Days Sales Outstanding (DSO) | High | Moderate | Measuring average collection speed and baseline liquidity | Skewed by sales volume changes; excludes cash sales |
| AR Turnover Ratio | Moderate | Moderate | Assessing frequency of cash conversion annually | Uses averages that can mask specific problem accounts |
| Aging Schedule | Moderate | High | Identifying high-risk accounts and prioritizing collections | Provides only a snapshot; lacks trend visibility unless tracked over time |
| Collections Effectiveness Index (CEI) | Low (Complex) | High | Evaluating collection team performance regardless of sales | Requires multiple data points and specialized software |
| Average Days Delinquent (ADD) | Moderate | High | Isolating collection inefficiencies from credit term impacts | Requires calculating Best Possible DSO first |
| Bad Debt-to-Sales Ratio | High | Low | Assessing effectiveness of customer credit screening | A lagging indicator; doesn’t show cash flow speed |
Conclusion
Keeping track of accounts receivable involves more than just focusing on one metric. While Days Sales Outstanding (DSO) gives a quick view of how fast payments are collected, it can sometimes paint a misleading picture – especially when sales volumes vary or when a few large, current invoices overshadow smaller, overdue ones. By combining DSO with the Collection Effectiveness Index (CEI), businesses get a more complete understanding: DSO shows how long collections take, while CEI measures how much of the available cash is actually recovered. Even if DSO remains steady, a drop in CEI can reveal gaps in collections, signaling the need for further investigation.
Metrics like AR Turnover Ratio and Average Days Delinquent (ADD) build on the insights from DSO by clarifying whether delays are due to relaxed credit terms or genuine late payments. Aging schedules, on the other hand, help identify high-risk accounts, particularly those with balances over 90 days. As KPM CPA explains:
"Without context, an AR balance or ratio can be misleading. For example, collecting in 45 days might sound reasonable. However, if the industry average is 30 days, you’re financing your customers longer than your competitors are…"
No single metric can provide all the answers. By combining these tools, businesses can create an early warning system to detect changes in customer payment habits or internal inefficiencies before they impact working capital. For companies looking to improve their receivables management and minimize payment risks, resources like CreditInsurance.com offer valuable tools and solutions to protect cash flow and manage credit exposure effectively.
FAQs
How can DSO and the Accounts Receivable Turnover Ratio help improve cash flow management?
Days Sales Outstanding (DSO) tells you how long, on average, it takes for customers to pay their invoices. Meanwhile, the Accounts Receivable (AR) Turnover Ratio measures how often a company collects its receivables in a year. Together, these two metrics provide a clear picture of your cash flow performance: DSO highlights the speed of collections, while the AR Turnover Ratio reflects the frequency.
For instance, if your DSO rises while your AR Turnover Ratio drops, it could signal slower collections and potential cash flow issues. Conversely, a lower DSO paired with a higher turnover ratio points to quicker cash conversion and more effective management of receivables. By keeping an eye on these patterns, you can refine credit terms, prioritize overdue accounts, and make more reliable cash flow projections.
CreditInsurance.com offers tools and insights designed to help businesses track these metrics and safeguard their cash flow with solutions like credit insurance. Regularly incorporating these measurements into your financial reporting can help reduce risks, enhance liquidity, and support long-term growth.
Why isn’t DSO enough to measure accounts receivable performance on its own?
DSO, or Days Sales Outstanding, can be a helpful metric for assessing accounts receivable, but it’s far from perfect when used on its own. One major issue is the lack of a universal calculation method – companies might use different time frames or revenue figures, which can lead to inconsistent results. On top of that, DSO doesn’t factor in critical elements like credit terms, seasonal trends, the age of invoices, or overall cash flow health.
Because of these limitations, relying solely on DSO can leave gaps in understanding the true quality of your accounts receivable or how efficient your collections process really is. To get a clearer and more reliable picture, it’s essential to pair DSO with other metrics and insights that align with your specific business operations.
How can an aging schedule help identify high-risk accounts and improve collections?
An aging schedule breaks down outstanding invoices into time-based categories like current, 1–30 days past due, 31–60 days, 61–90 days, and over 90 days. This categorization makes it simple to pinpoint overdue accounts and flag high-risk customers who might need immediate attention to avoid potential bad debt.
By regularly analyzing the aging schedule, businesses can identify payment patterns, refine their collection strategies, and decide whether to halt further shipments or services until outstanding balances are cleared. This approach not only helps prioritize collections but also enhances cash flow forecasting and prepares businesses to handle potential losses from unpaid debts.
For companies aiming to improve credit risk management, CreditInsurance.com offers resources and solutions, including guidance on how accounts receivable insurance can safeguard against non-payment while enabling growth through more favorable credit terms.